Platform and Apps
Designed for shaping better decision
[rev_slider platform_en][rev_slider platform_en_mobile]
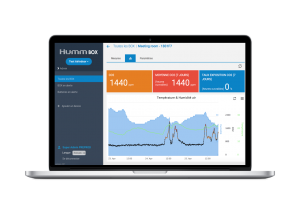
Dashboard & KPI
Dashboard & KPI allow to quickly shape the best decision.

- Interactive charts with multiple series display (hide series…)
- Zoomable timeline charts
- DataViz
- KPIs are adapted to the solution and the use case:
For example
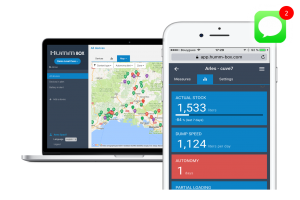
- Tank Monitoring: Autonomy prediction, Actual stock, Possible partial loading, …
- Air monitoring: CO2 average working hours, Over threshold CO2 percentage, Air temperature & moisture, …
- Vegetation monitoring: Soil temperature and moisture, Air temperature and humidity, Watering autonomy, CO2 (Greenhouse monitoring), …
Maps & Alert
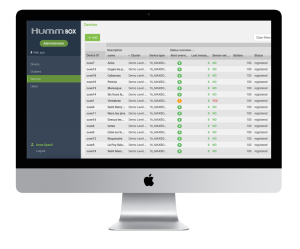
Device management
Platform & Saas
- Data cleaning process
- Data shaping (transformation process from measure to business valuable data)
- Data aggregation
- Business rules for alerting process
- Predictive analysis
Interoperability:
- Multi service connector
- REST API
Software as “a service”:
- Availability SLA
- Platform administration
- Database redundancy
- Scalability
- Server monitoring 24/7 : availability and response time
- New features included
- Maintenance and support


